
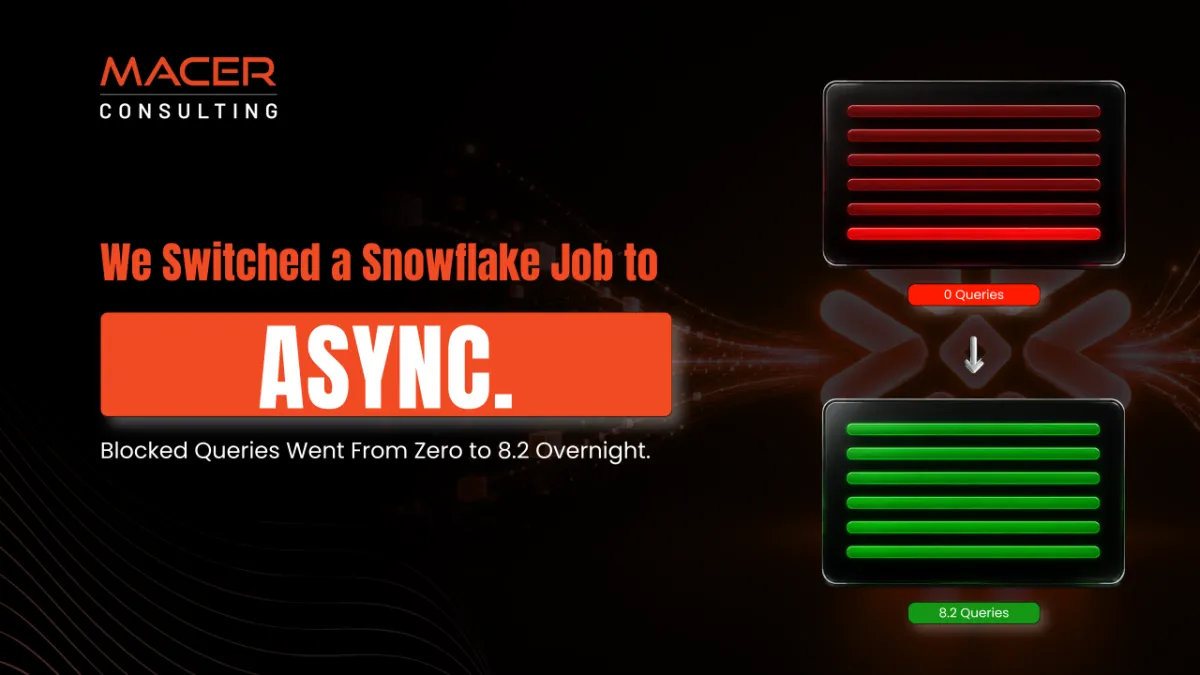
We Switched a Snowflake Job to ASYNC. Blocked Queries Went From Zero to 8.2 Overnight.
Introduction:
For two full days before a Snowflake job switched from sequential to ASYNC, its warehouse had never once recorded a blocked query.
The day after cutover, the average number of blocked queries hit 8.2 at once.
Nothing in the job's success or failure status told us that.
The gap in switching to ASYNC
Redesigning a pipeline for concurrent execution buys real speed. That part is proven, documented, and repeatable. What it also does, quietly, is introduce a failure mode that the sequential version was structurally incapable of producing.
A sequential pipeline runs one query at a time. There is nothing else present to contend with, so it cannot generate lock contention, ever, by design, not by luck. The moment independent steps run concurrently and touch a shared object, like a logging table, that guarantee is gone.
The job still finishes. Snowflake queues the blocked statement and lets it through once the lock clears, up to a limit. That's exactly why this is easy to miss: nothing fails, nothing pages anyone, the pipeline reports success. The cost shows up as a growing tax on runtime, invisible until it either erodes the speed gain you switched for or crosses the 20-statement DML lock-waiter ceiling and throws error 000625 (57014) in production.
What actually happened on this account
We caught this while we were on an enterprise client's pipeline, not from a dashboard alert. We noticed the job was still green and started digging into why it felt slower than it should. Before treating any of this as theory, it's worth showing the real numbers instead of asserting them.
SNOWFLAKE.ACCOUNT_USAGE.WAREHOUSE_LOAD_HISTORY on the warehouse running this pipeline shows avg_blocked at exactly zero on every five-minute interval across two full days before cutover, including two separate stretches where multiple queries were already running concurrently for unrelated reasons. Concurrency alone didn't cause blocking. Concurrency against a shared object did.
The day of cutover, the first blocked query appears within hours, and by early afternoon the warehouse shows an average of 8.2 queries blocked at once in a single five-minute window. That is not a rounding artifact. That is real, measured lock contention that structurally could not have existed the day before.
The monitoring layer nobody builds on day one
Here's the pattern worth taking from this. The metric that tells you whether an async redesign is healthy is not job success. It's blocking trend.
Three views cover it, each answering a different question:
Is the warehouse under lock pressure right now, and is it getting worse?
SELECT start_time, avg_running, avg_queued_load, avg_blocked
FROM SNOWFLAKE.ACCOUNT_USAGE.WAREHOUSE_LOAD_HISTORY
WHERE warehouse_name = 'YOUR_WH'
ORDER BY start_time DESC;
Watch avg_blocked as a trend line, not a single reading. A number that's small but climbing across consecutive batches is the leading indicator that shows up well before the hard failure does.
Which specific queries are blocked right now?
SELECT query_id, query_text, execution_status, start_time, warehouse_name
FROM TABLE(INFORMATION_SCHEMA.QUERY_HISTORY())
WHERE execution_status = 'BLOCKED'
ORDER BY start_time;
This is the query-level drill-down once the warehouse view tells you something is off. INFORMATION_SCHEMA is low-latency but short retention, ACCOUNT_USAGE trades latency for a year of history, use the one that matches whether you're watching live or investigating after the fact.
Did this actually start when I think it did?
SELECT start_time,
  CASE WHEN query_text ILIKE '%YOUR_ASYNC_PROC%' THEN 'ASYNC'
       WHEN query_text ILIKE '%YOUR_OLD_PROC(%' THEN 'SEQUENTIAL' END AS proc_version
FROM SNOWFLAKE.ACCOUNT_USAGE.QUERY_HISTORY
WHERE query_text ILIKE '%YOUR_OLD_PROC%'
ORDER BY start_time;
This one isn't for daily monitoring, it's for establishing the baseline once. Confirming the exact cutover timestamp is what let us prove the blocking was zero before and non-zero after, instead of assuming it.
Set the threshold before you need it
None of this is useful bolted on after an incident. The right time to wire avg_blocked into a dashboard or an alert threshold is the same day the ASYNC redesign ships, not the week after a production job trips the 20-statement limit.
A reasonable starting point: alert when avg_blocked on the pipeline's warehouse exceeds roughly a quarter of your configured batch size for two consecutive intervals. That gives you room to see contention building while it's still a performance tax, well before it becomes a hard error with a client watching the job status.
The redesign that made the job fast is also the redesign that made a new failure mode possible. Monitor for the failure mode you just introduced, not just the one you fixed.
If you've moved a pipeline to concurrent execution, what did you end up watching to catch contention before it caused an outage? I read every reply.
If your team shipped a performance redesign without a plan for what new failure modes it opened up, that gap is exactly what the AI Readiness Assessment is built to surface before an auditor or an outage finds it first.
Follow Reeves Smith for practical insights on AI, enterprise data strategy, and governance.
Originally published at https://www.linkedin.com.